By Sarhind Times Environment Bureau | New Delhi | October 2, 2025
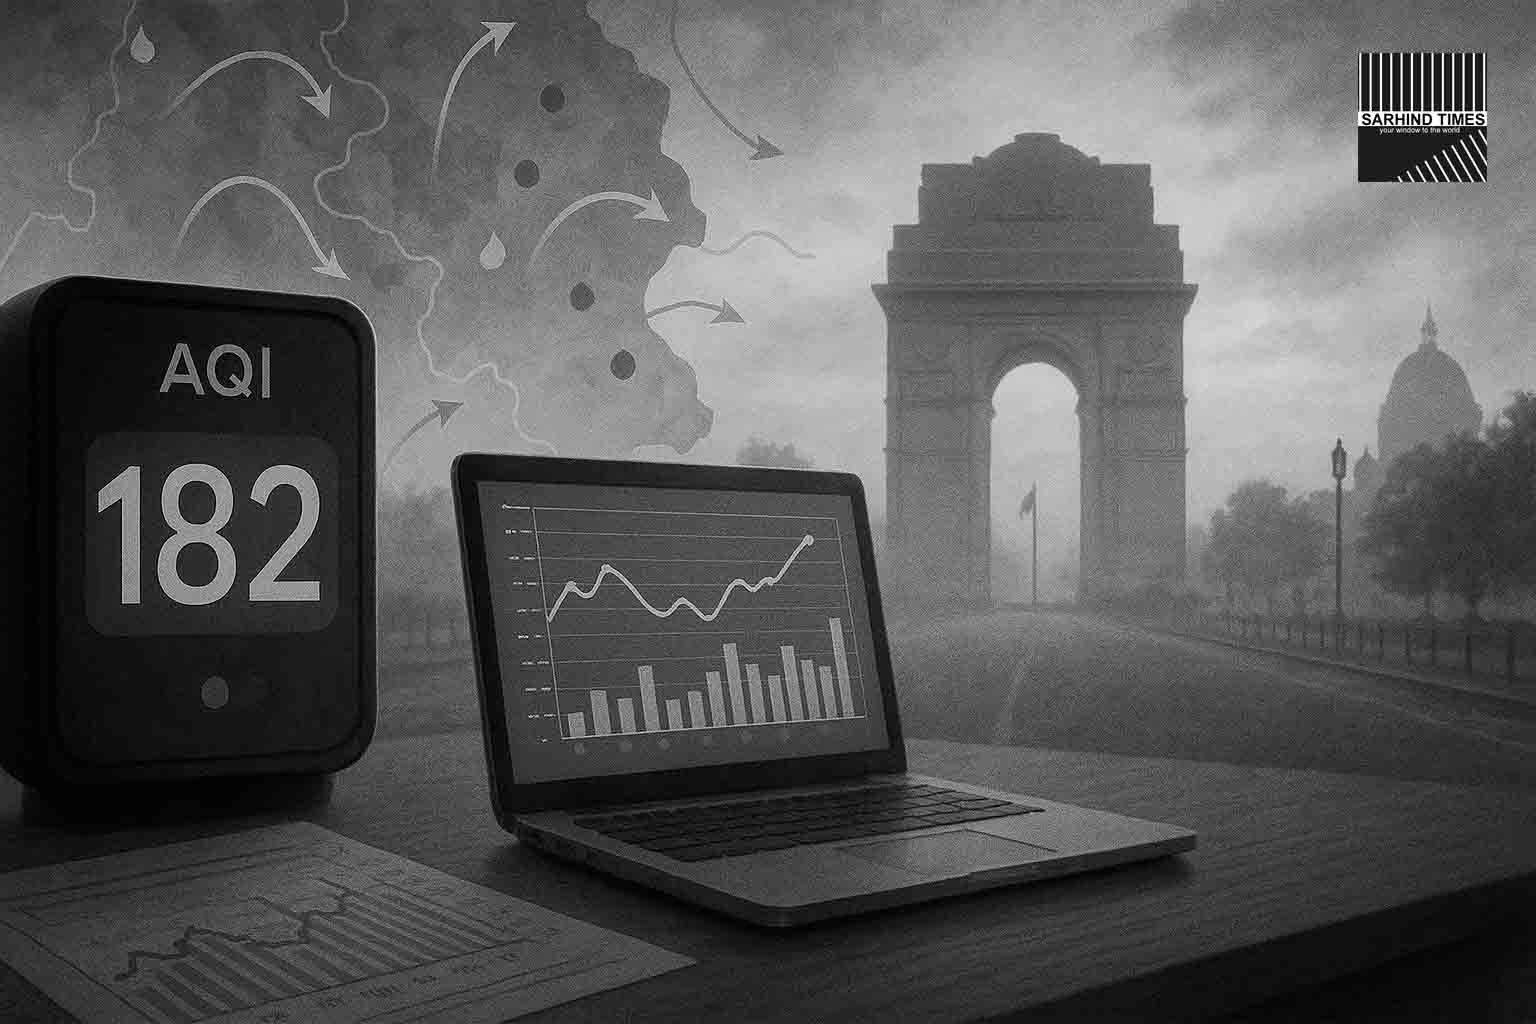
NEW DELHI: Delhi’s revamped, AI-aided early-warning framework for air pollution opened to a promising start, with officials saying the system got “around 90% of cases right” on Day-1 as it correctly flagged a “Poor” air-quality band for the city. The tool blends meteorological models and machine-learning signals to give agencies a multi-day lead on likely AQI categories so that Graded Response Action Plan (GRAP) restrictions can be sequenced with greater precision—curbing blanket bans and improving public advisories. While authorities touted the launch-day hit rate, a separate evidence review released this week found the capital’s Air Quality Early Warning System (AQEWS) has consistently delivered 80%+ accuracy in flagging “very poor and above” days over the last two winters, underscoring a broader improvement in forecasting that GRAP depends on.
Doctors, meanwhile, warned that “Poor” still aggravates respiratory and cardiac conditions—particularly for children, the elderly and those with asthma or COPD—advising masks in peak hours, limited outdoor exertion, and attention to indoor filtration where possible. Civil groups welcomed the transparency push but pressed for faster bus electrification, garbage-burning enforcement, and year-round source-attribution dashboards so that interventions match the actual drivers each week.
Key takeaways (at a glance)
- Day-1 performance: Officials say the AI-aided framework hit ~90% accuracy on launch day and nailed the “Poor” band; independent analysis this week pegs Delhi’s broader forecasting system at 80%+ accuracy for high-pollution days across the past two winters.
- What’s new: Machine-learning inputs augment the IMD–IITM AQEWS ensemble and the Decision Support System (DSS) that estimates regional & sectoral contributions (e.g., stubble burning, transport).
- Why it matters: GRAP stages (I–IV) will be triggered earlier, with finer thresholds, aligning curbs to forecast bands rather than waiting for deterioration to show up in same-day readings.
- Independent scorecard: A study by CEEW finds AQEWS predicted 83 of 92 “very poor or worse” days in 2023-24 and 54 of 58 in 2024-25; forecasting of “severe” smog (AQI ≥400) improved year on year.
How Delhi’s early-warning stack works—now with an AI layer
Delhi’s forecasting “stack” rests on three planks:
- AQEWS (Air Quality Early Warning System) — run by IITM Pune and IMD, it mixes global and regional chemical-transport models, meteorology and emissions to produce 3–10-day forecasts of AQI bands and pollutants (PM₂.₅, PM₁₀, NO₂, O₃, etc.).
- DSS (Decision Support System) — a CAQM-mandated, IITM-built module that adds source attribution (what share comes from Delhi’s transport, industry, dust, waste-burning, etc.) and scenario tools (what if we curb construction by X% or restrict heavy-duty traffic). It has already guided episodic restrictions in past winters.
- AI/ML augmentation — the city’s “revamped” layer uses machine-learning signals trained on monitor data, weather fields, and mobility/seasonality patterns to stabilize band predictions and reduce false alarms. (Officials said the Day-1 validation matched ground monitors in ~90% of grid-level checks, with the observed category landing in the same “Poor” band as forecast.) Independent reporting today—separate from the Day-1 claim—finds AQEWS’ recent winter accuracy >80%, with notable gains in forecasting “severe” days, which are historically harder to nail.
In practice, these outputs feed CAQM’s GRAP sub-committee and city departments, who can pre-stage actions (anti-smog guns, diesel-gen curbs, truck restrictions if needed), ready advisories, and coordinate enforcement before a bad-air spell peaks.
Day-1: a “Poor” forecast that matched the day
Launch morning, the model ensemble signalled low winds, shallow mixing, and upwind residue burning as the key drivers—typical of early-October stagnation. The observed AQI category fell in the same band the system projected, officials said, giving confidence to proceed with fine-tuned GRAP I actions (e.g., stepped-up PUC checks, bans on certain fuels at eateries, tighter generator use in non-emergency settings). As the winter arc builds, authorities say multi-day lead times will help avoid whiplash (on today, off tomorrow) and reduce one-size-fits-all bans. (Independent outlets today also highlighted broad-season forecasting accuracy of 80%+, based on two winters of data.)
Will this actually change GRAP on the ground?
Yes—earlier and more targeted. GRAP is tiered into four stages based on AQI: Stage I (Poor: 201–300), Stage II (Very Poor: 301–400), Stage III (Severe: 401–450), Stage IV (Severe+: >450). The sub-committee can pre-activate measures if the forecast shows likely breach, and revoke once forecasts turn benign. Having more reliable, finer-grained forecasts (and attribution from DSS) means the city can sequence measures and restore normalcy quickly when conditions ease, instead of keeping severe curbs longer than necessary.
Recent CAQM orders illustrate this forecast-led nimbleness: Stages have been activated and revoked multiple times in 2025, referencing IMD/IITM forecasts alongside observed AQI trends—exactly the workflow the upgraded system wants to improve.
Accuracy check: what the independent study says
A new analysis by the Council on Energy, Environment and Water (CEEW)—covered across multiple outlets today—finds Delhi’s AQEWS predicted over 80% of “very poor and above” days in the past two winters. It also notes a big jump in correctly flagging “severe” smog (AQI ≥400): from 1 out of 15 days in 2023–24 to 5 out of 14 in 2024–25. The authors recommend operating the DSS year-round, updating emission inventories more frequently, and opening data for researchers—steps that could lift accuracy further and make interventions more proportionate to sources.
Bottom line: The science is trending better, but inputs need refreshing—especially emissions data and sectoral fingerprints—to prevent under-prediction on marginal days.
What “AI-aided” actually means (and what it does not)
- It augments, not replaces, physics. The core engine remains weather-chemistry modeling (transport, mixing, chemistry). ML learns from lived data (monitor grids, wind, humidity, holidays, harvest cycles) to improve band stability and reduce spurious swings close to thresholds
- Attribution matters. The DSS quantifies contributions (e.g., transport vs. neighboring districts vs. stubble burning) and can simulate “what-if” interventions—valuable when deciding which curbs to use. In a documented 2021 episode, CAQM’s DSS-guided package helped push PM₂.₅/AQI down ~20% during an acute spell, demonstrating policy utility.
- It won’t “solve” pollution by itself. Forecasts are decision tools, not end-states. Enforcement, fuels, mobility, waste and dust control decide outcomes.
Health lens: “Poor” is not benign
Even “Poor” air (AQI 201–300) is unhealthy for sensitive groups; sustained exposure raises symptoms in kids, seniors, and those with lung/heart disease. As winter inversions deepen, doctors recommend: N95/FFP2 masks outdoors during peak hours, avoidance of strenuous runs, in-home HEPA filtration where possible, and vigilance with asthma inhalers/medication adherence. (For real-time context, city AQI trackers today showed “moderate to unhealthy-for-sensitive-groups” levels varying by station.)
What changes for you this season
For commuters
- Expect earlier advisories: parking/traffic curbs can kick in ahead of spikes; Odd-Even remains a separate policy lever, used episodically by governments (not an automatic GRAP item).
- Two-wheeler riders: carry an FFP2 and clear glasses for fog-mix mornings.
For builders & facility managers
- Construction controls will be sequenced faster with forecasts; keep anti-dust measures ready (covering, wheel-wash, water fogging) and DG-set compliance for Stage-I/II days.
For schools & offices
- You may see flex schedules or reduced outdoor activities on forecasted high-AQI days; keeping indoor PM₂.₅ under 35 μg/m³ is a defensible target.
For RWAs
- Expect ward-level dashboards as new sensors come online through winter; log garbage-burning and generator smoke to hotlines—both are preventable spikes.
Stubble burning, dust and the seasonal “mix”
As October advances, the Punjab–Haryana stubble window opens; DSS will attribute the fraction contributed by residue fires vs local sources daily, and this will increasingly shape which curbs are emphasized. In early-winter, regional transport and biomass burning often dominate; by mid-winter, traffic, waste burning and domestic fuels can rise in share as wind slackens. DSS contributions—and the CEEW call for better inventories—aim to keep policy source-proportionate, not just city-wide.
Governance: GRAP 2.0 depends on forecast-led agility
What’s new in practice:
- Faster activation: Sub-committee decisions can cite 3–5-day forecasts to pre-stage Stage I–II actions and warn industry/logistics earlier.
- Faster revocation: When IMD/IITM models point to winds/rain cleansing, Stage III/IV curbs can be revoked swiftly to reduce economic disruption. Recent orders show this pattern in 2024-25 and 2025.
- Transparent logs: Public links to AQEWS and DSS portals allow media and citizens to cross-check the science behind activations.
The limitations—straight up
- Emission inventories age quickly. If source inventories lag real-world change (new fleets, fuels, patterns), models under-predict bad episodes; CEEW urges regular updates and open data.
- DSS seasonality. DSS has historically run winter-focused, leaving shoulder seasons less covered; experts recommend year-round operation.
- Attribution disputes. On marginal days, different methods split contributors differently; transparency in assumptions reduces confusion.
- No model is perfect. Even IMD’s broader forecast accuracy goals acknowledge uncertainty; that’s why officials look for confluence: multiple models + observations.
What success will look like by January
- Fewer blanket bans, more micro-targeted curbs tied to specific sources/sectors.
- Shorter durations of Stage III/IV because revocation keeps pace with improving forecasts.
- Public dashboards many more people can read—“what’s driving today” becomes part of everyday weather chatter.
- Health messaging anchored to forecast bands (e.g., school sports moved indoors before a spike).
How to read the dashboards (citizen’s cheat-sheet)
- AQEWS portal: Check the 3-day AQI band and pollutant trajectories (PM₂.₅/PM₁₀). Flat lines near thresholds mean tiny changes in wind can flip categories.
- DSS: Look for % contribution bars—transport, industry, dust, residue fires—to understand why a certain GRAP mix is used.
- Agency orders: See CAQM notices for stage activation/revocation and the list of actions in force today.
The road (and air) ahead
Cloud-seeding pilots, expanded sensor networks, dust-suppression standards and electrified public transport are in motion this season; none of them replaces the need for clean fuels, waste discipline, and steady enforcement. Forecasts are now good enough to time those actions better—the real gains will come if the city uses that time well. Early signs from the AI-aided launch are encouraging; the winter grind will be the proof.
#DelhiAir #AQI #GRAP #AirQuality #IMD #IITM #CAQM #DSS #MachineLearning #PublicHealth


+ There are no comments
Add yours